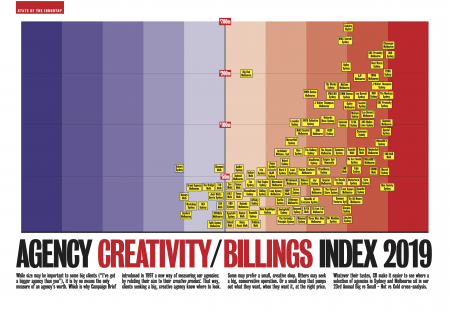
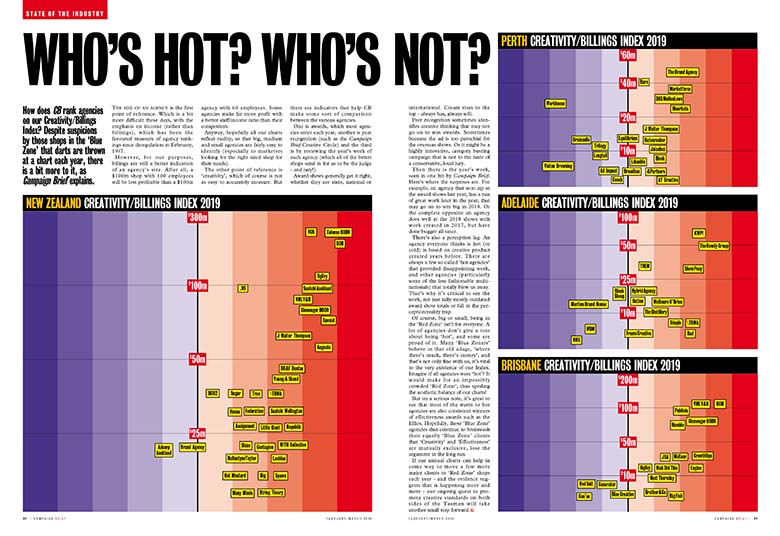
Download your FREE hi-res PDF of the Campaign Brief Hot+Cold Chart for Sydney+Melbourne, Perth, Adelaide, Brisbane and New Zealand

The annual CB AgencyCreativity/Billings Index (or Hot+Cold Chart) is a must for all agency CEOs and ECDs plus marketers on the look-out for a new agency – or to see where their agency is placed in the industry.
There is a chart for Melbourne/Sydney, plus Adelaide, Brisbane and Perth, as well as New Zealand.
These hi-res PDFs can be printed out and pinned on your wall – or you can blow up to A2 or A1 and frame.
Download the 2019 Perth Chart
Download the 2019 Adelaide Chart
Download the 2019 Brisbane Chart
Download the 2019 New Zealand Chart
 About the CB Hot+Cold Chart:
While size may be important to some big clients (“I’ve got a bigger agency than you”), it is by no means the only measure of an agency’s worth. Which is why Campaign Brief introduced in 1997 a new way of measuring our agencies: by relating their size to their creative product.
That way, clients seeking a big, creative agency know where to look. Some may prefer a small, creative shop. Others may seek a big, conservative operation. Or a small shop that pumps out what they want, when they want it, at the right price.
Whatever their tastes, CB make it easier to see where a selection of agencies in Australia and New Zealand sit in our 23rd Annual Big vs Small – Hot vs Cold cross-analysis.
You can view this issue and past CB issues and subscribe at Campaign Brief Online or contact Mina via email.
