Download your FREE hi-res PDF of the Campaign Brief Hot+Cold Chart for Sydney+Melbourne, Perth, Adelaide, Brisbane and New Zealand
The annual CB Agency Hot+Cold Chart is a must for all agency CEOs and ECDs plus marketers on the look-out for a new agency – or to see where their agency is placed in the industry.
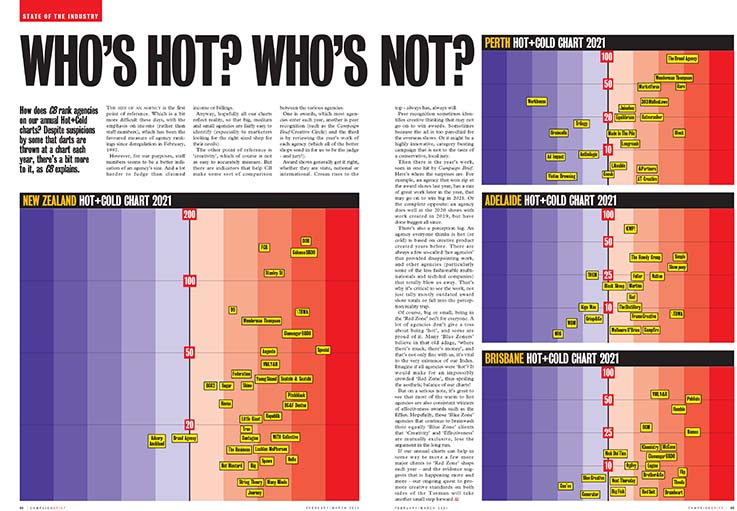
There is a chart for Melbourne/Sydney, plus Adelaide, Brisbane and Perth, as well as New Zealand.
These hi-res PDFs can be printed out and pinned on your wall – or you can blow up to A2 or A1 and frame.
Download the 2021 Sydney/Melbourne Chart:
CB-HOT+COLD-CHART-2021
Download the 2021 Perth Chart:
CB-PERTH-HOT+COLD-CHART-2021
Download the 2021 Adelaide Chart:
CB-ADELAIDE-HOT+COLD-CHART-2021
Download the 2021 Brisbane Chart:
CB-BRISBANE-HOT+COLD-CHART-2021
Download the 2021 New Zealand Chart:
CB-NZ-HOT+COLD-CHART-2021
About the CB Hot+Cold Chart:
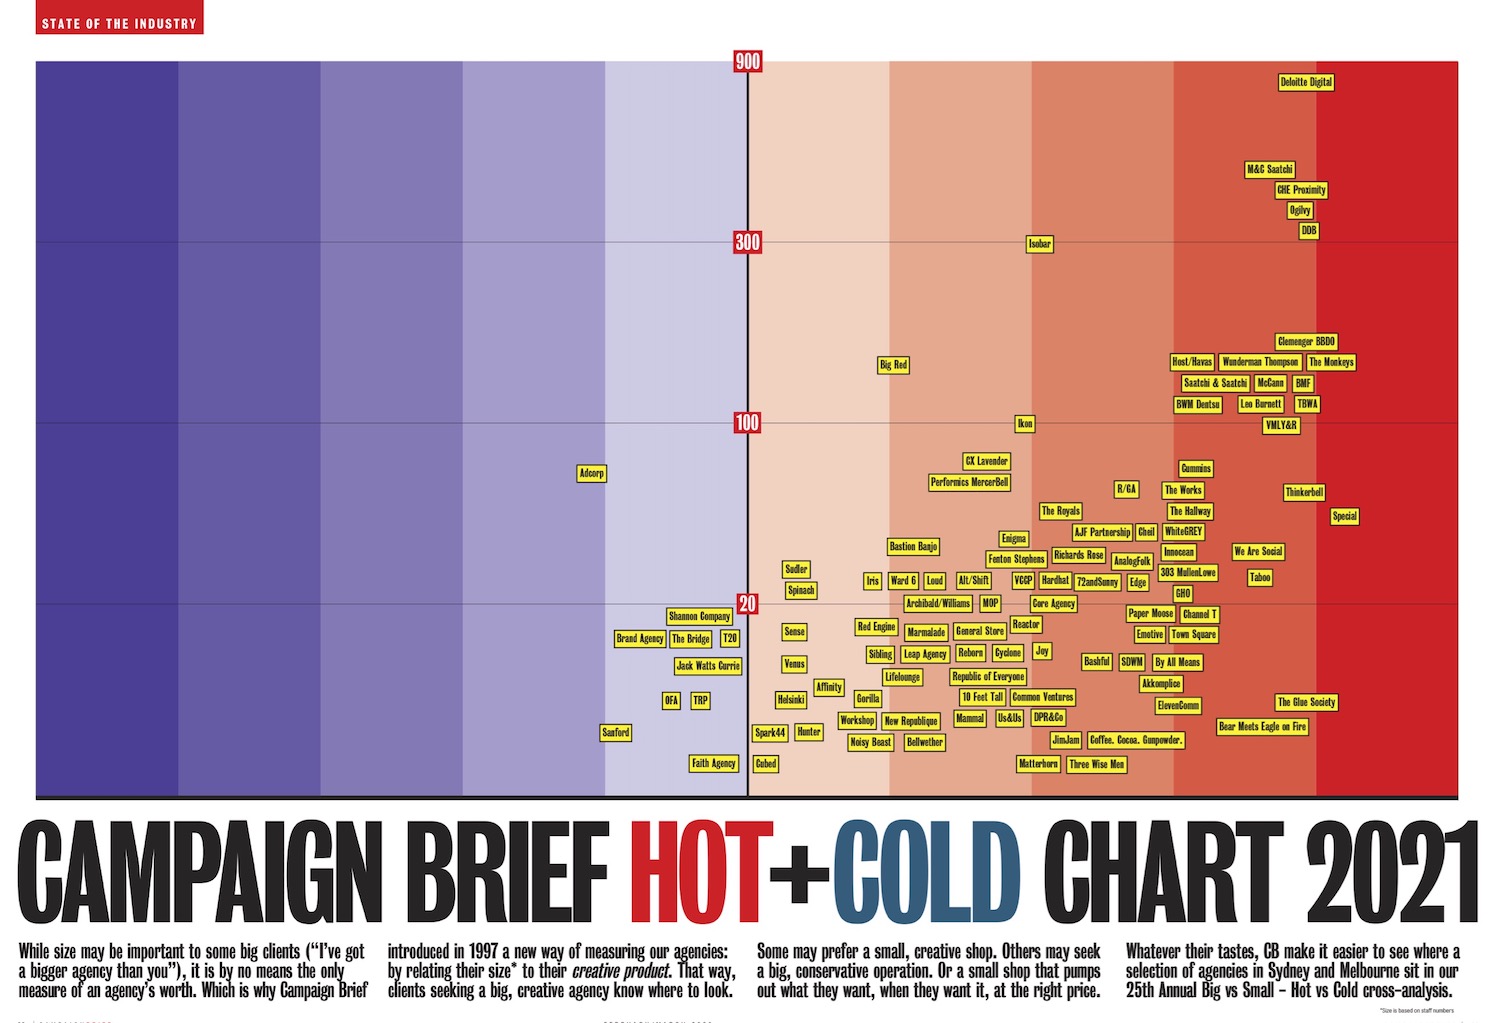
While size may be important to some big clients (“I’ve got a bigger agency than you”), it is by no means the only measure of an agency’s worth. Which is why Campaign Brief introduced in 1997 a new way of measuring our agencies: by relating their size to their creative product.
That way, clients seeking a big, creative agency know where to look. Some may prefer a small, creative shop. Others may seek a big, conservative operation. Or a small shop that pumps out what they want, when they want it, at the right price.
Whatever their tastes, CB make it easier to see where a selection of agencies in Australia and New Zealand sit in our 25th Annual Big vs Small – Hot vs Cold cross-analysis.
You can view this issue and past CB issues and subscribe at Campaign Brief Online or contact Mina via email.
5 Comments
Since when is Deloitte an advertising agency? I’ve been away from Aus way too long
@ Sohail, Since 2017: https://campaignbrief.com/deloitte-digital-lures-adrian/?fbclid=IwAR0VAmIfYEzWt1ctfN30KHDYs504ZqfnkGCFCCkyFPxe-698x3dnkFyxNyo
Would be good to get some consistency on the size of the Agencies!
@billings or revenue: It’s by number of staff, not billings or revenue.
How is the creative scale measured? Output, clients or quality of work?